
If you’ve spent any time in Google Analytics, you know the wide array of metrics you can track – and if you’re not careful, they can all feel equally essential.
They’re not.
On the other hand, if you’re mostly keeping up with the big four (pageviews, sessions, time on page and bounce rate), you’re missing out on some powerful data that’s also pretty easy to find. Those big four metrics are covered extensively elsewhere on the interwebs, so I won’t cover them here. (If they are new to you, the folks at MOZ have the Absolute Beginner’s Guide to Google Analytics. And, if you still have questions after that …

Moving on …
After years of tracking engagement metrics for multiple industries, I’ve found many to be very important – but five consistently stand out every time. (Note: I include images from Google Analytics to show locations of the five metrics. I’ve blocked out some content intentionally.)
Five easy & essential metrics to track in Google Analytics
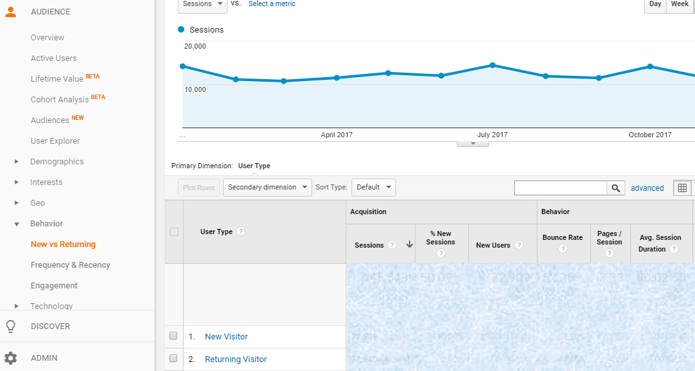
New vs Returning Visitors
How loyal are visitors / customers to your website? How well are your inbound & outbound efforts driving new visitors? These are important questions, and the New vs Returning Visitors tab is an easy way to get a high-level view.
While there is no perfect percentage for either group (it really depends on the goals of your site), you can keep this in mind: if you see New Visitors spike over time while Returning Visitors plummet, you know that people love coming to your site … but, they don’t love coming back. If you see the opposite trend, then you have a core set of visitors, but no new traffic, which can be equally troubling (again, this also depends on the goals of your site).
How you get there: Audience (in the left column) > Behavior > New vs Returning
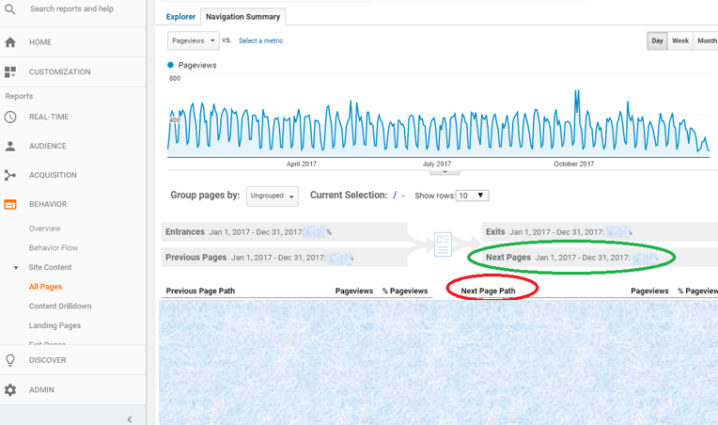
Navigation Summary
So your website’s homepage has 30,000 pageviews this month. Great! But what pages are visitors viewing afterward? This is a critical question, because it helps you determine where visitors are naturally travelling, thus providing you some nice insight into where to put valuable links, call outs, ads and gated components.
That’s where the Navigation Summary comes in. Here, you’ll see the percentage of visitors continuing on your site from the page you’re analyzing (green circle below) – and most importantly, you’ll see what pages are most viewed afterward (red circle). There’s lots of other good info here as well, like how many visitors are exiting the page, what previous pages they came from and more, but that’s beyond the scope of this section.
How you get there: Click Behavior > Site Content > All Pages > (Select a Page) > Click the Navigation Summary tab near the top of the page
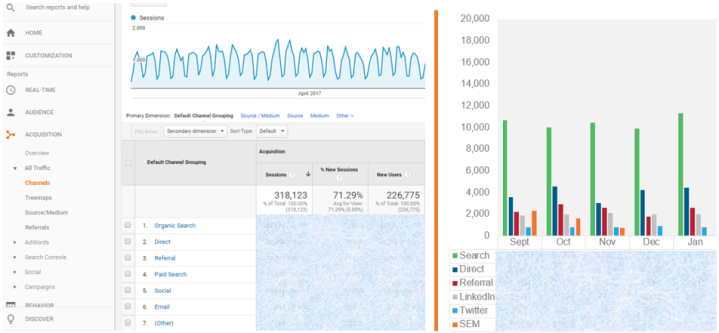
Traffic Channels
Visitors are great, but if you don’t know how they’re getting to your site, you’ll end up allocating a lot of marketing budget to blind trial & error campaigns.How much better it would be to know where visitors are organically coming from, so you can allocate budget intelligently toward Twitter, LinkedIn, Google and other referrers.
Enter the Traffic Channels metric. Here you’ll see what percentage of visitors come from various sources so you can know where you’re already winning the day in your inbound / outbound efforts and where you may need some paid support to bump up the numbers.
On a personal note, I don’t like the way Google presents this data, because the visual graph isn’t very helpful, and it lumps all social into one category (you just have to click the “social” metric to see numbers for specific social channels). For that reason, I keep a simple chart in Power Point where I can track all figures together with a better visual representation of which source is performing best (chart on the right). I actually do this with a lot of data in Google Analytics to make it easier to present metrics to those less metrics-savvy at companies, but the benefits of that is a post for another time.
How you get there: Acquisition > All Traffic > Channels
Location / Region
I am always surprised to see how often this metric overlooked, un-tracked or completely ignored. There are several reasons why this metric is important – I’ll give you two.
First, let’s say the majority of your traffic comes from the United Kingdom. Are you scheduling most of your traffic-driving social posts during Central Time afternoon hours in the U.S.? Unfortunately, you’re likely missing prime social activity hours for your core audience. Why not schedule some posts when they’re most active? Also, you may consider writing blogs that post during those hours so that a big percentage of your audiences/subscribers get alerted to fresh content right when it’s posted.
On the other hand, what if you’re aiming for a specific target market in the Mid West United States, but the majority of your traffic is coming from India? That’s definitely something you’ll want to know, so you can step back and make tweaks to address the issue. Many other reasons abound, but we’ll stop there.
How you get there: Click Audience (in the left column) > GEO > Location

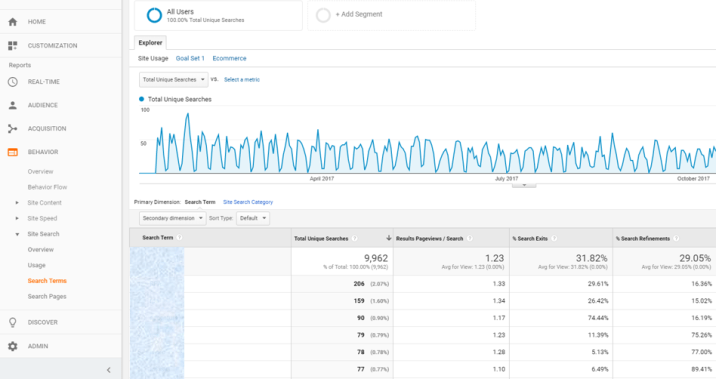
Site Search
Looking for an easy way to see what new content visitors would like to see on your site? Or which pages you should be making easier to find than others? Check out your Site Search metrics in Google Analytics! Not too long ago, I jumped into this tab for a client and was immediately able to recommend new content that would certainly bump up his numbers. How? Visitors were by and large searching for the same term on multiple pages within his site (including the page targeted for this term). They found a bit of content he had posted on a subject, liked what they saw and were looking for more, but none was to be found. Now that problem can be addressed. Your visitors may be telling you right now exactly what they’d like to see more of.
Site Search can also tell you if content is hard to find for users as well. Have a lot of searches on a specific subject, but no path to it in the nav or sub nav? Toss it in one of your navs and see if you can create a more seamless experience for visitors.
How you get there: Behavior > Site Search > Search Terms
There you have it. Much more could be said about each of these five important (and easy to find) metrics in Google Analytics, and much more is said across the web. However, with this as a kick start, I think you have all you need to begin to track and mine them for all their worth.
Have other metrics in Google Analytics or other analytics tools you prefer? Share them in the comments.
